Stocks and portfolio analysis platform
Stay on top of stocks
and your portfolio
Moula gives you one place to easily analyze stocks and track your portfolio performance, so you can ditch your clunky spreadsheets and focus on what matters: making smarter investment decisions.
Start free with 10 favorites. No credit card required.
Built for
A better way to track your portfolio and analyze stocks
Manual tracking and scattered tools leave you reconciling numbers and wondering if your numbers and decisions are right. Moula connects journal, portfolio, and analysis in one place to give you an edge.
| Spreadsheets / Google / Yahoo | ||
|---|---|---|
| Portfolio & P&L | × Manual formulas that break when you edit rows. Cost basis and ROI require maintenance. | Cost basis, profit, ROI derived from your trades. Portfolio updates automatically. |
| Charts & fundamentals | × Basic charts or unstable imports. Financials live in separate tools. Hard to compare. | Candlestick charts, indicators, SEC financials, P/S over time. All in one workspace. |
| Workflow | × Multiple tabs, bookmarks, and tools. Research and tracking are separate. | Journal, portfolio, and analysis in one app. One source of truth. |
How Moula fits your trading workflow
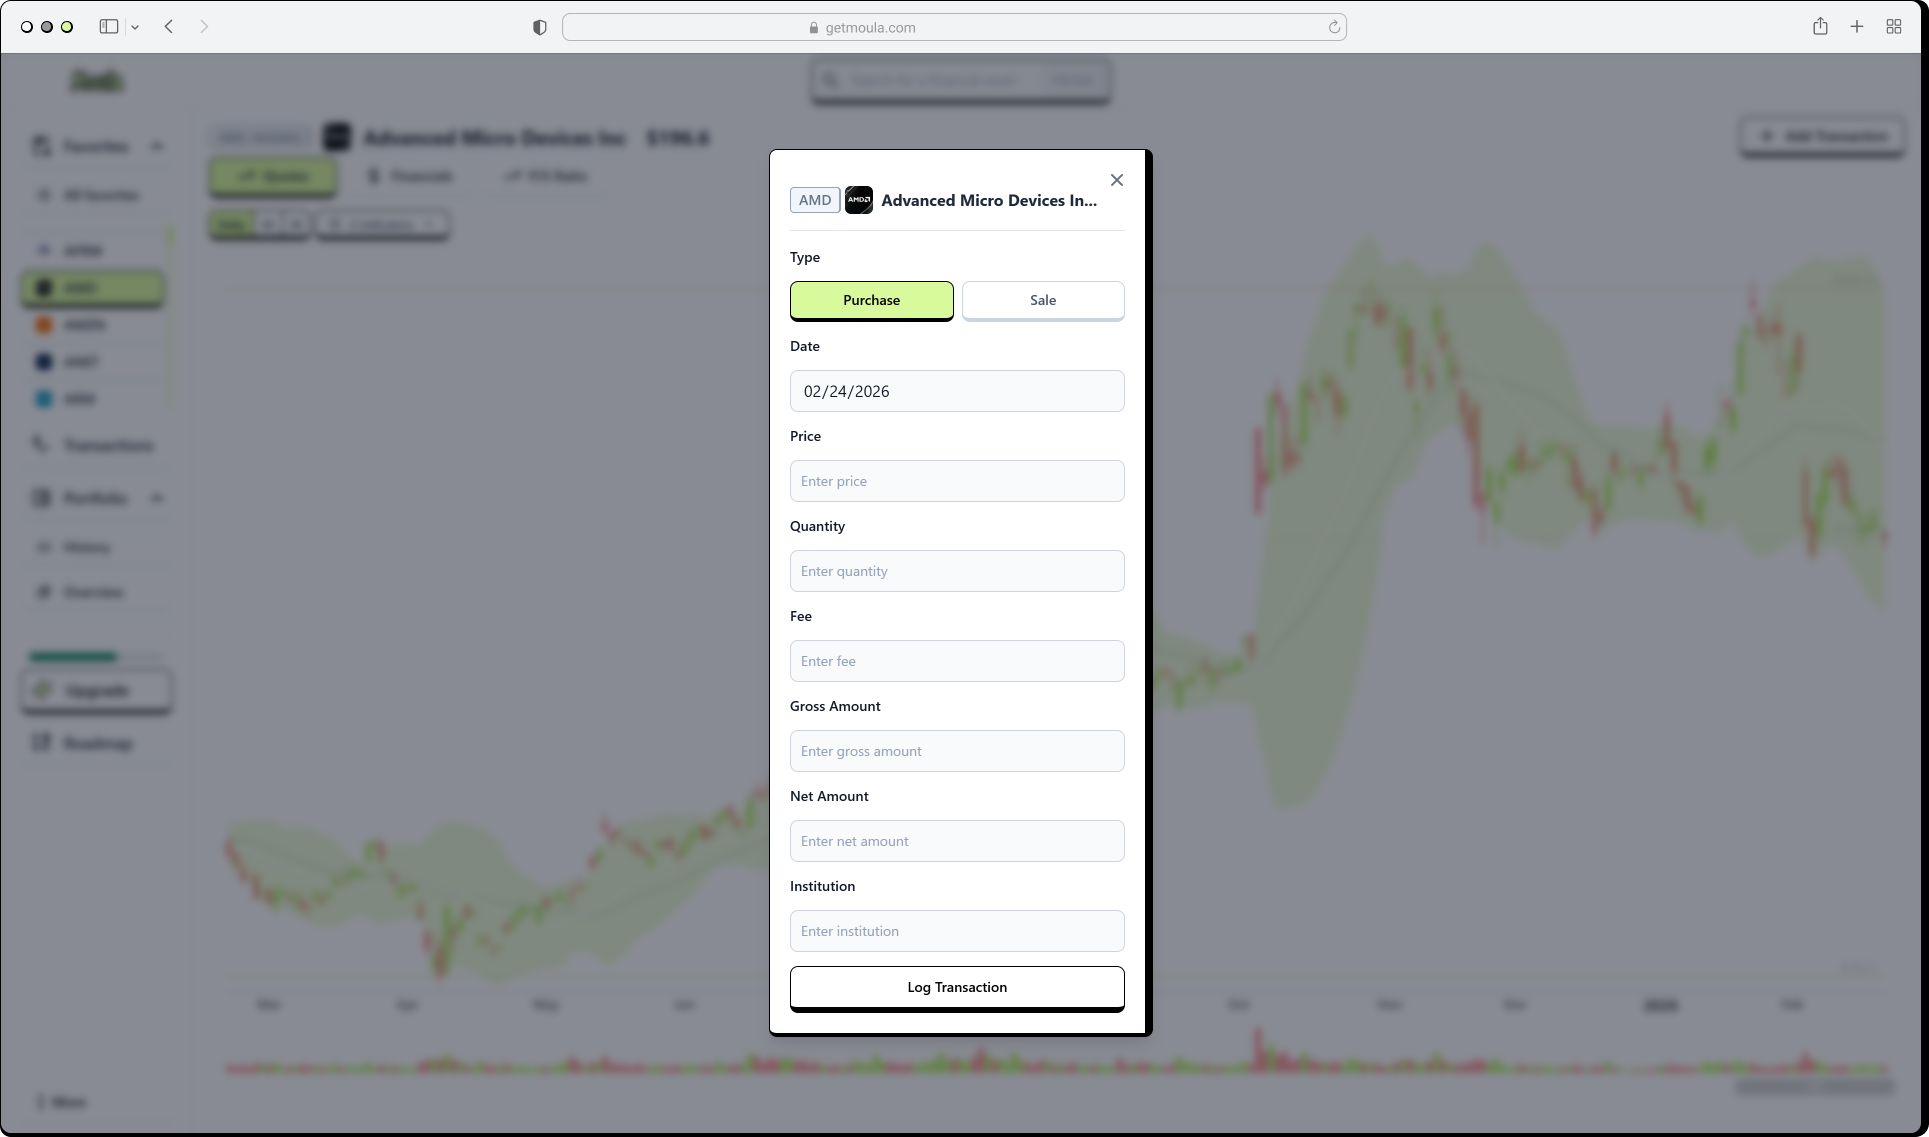
Log every trade
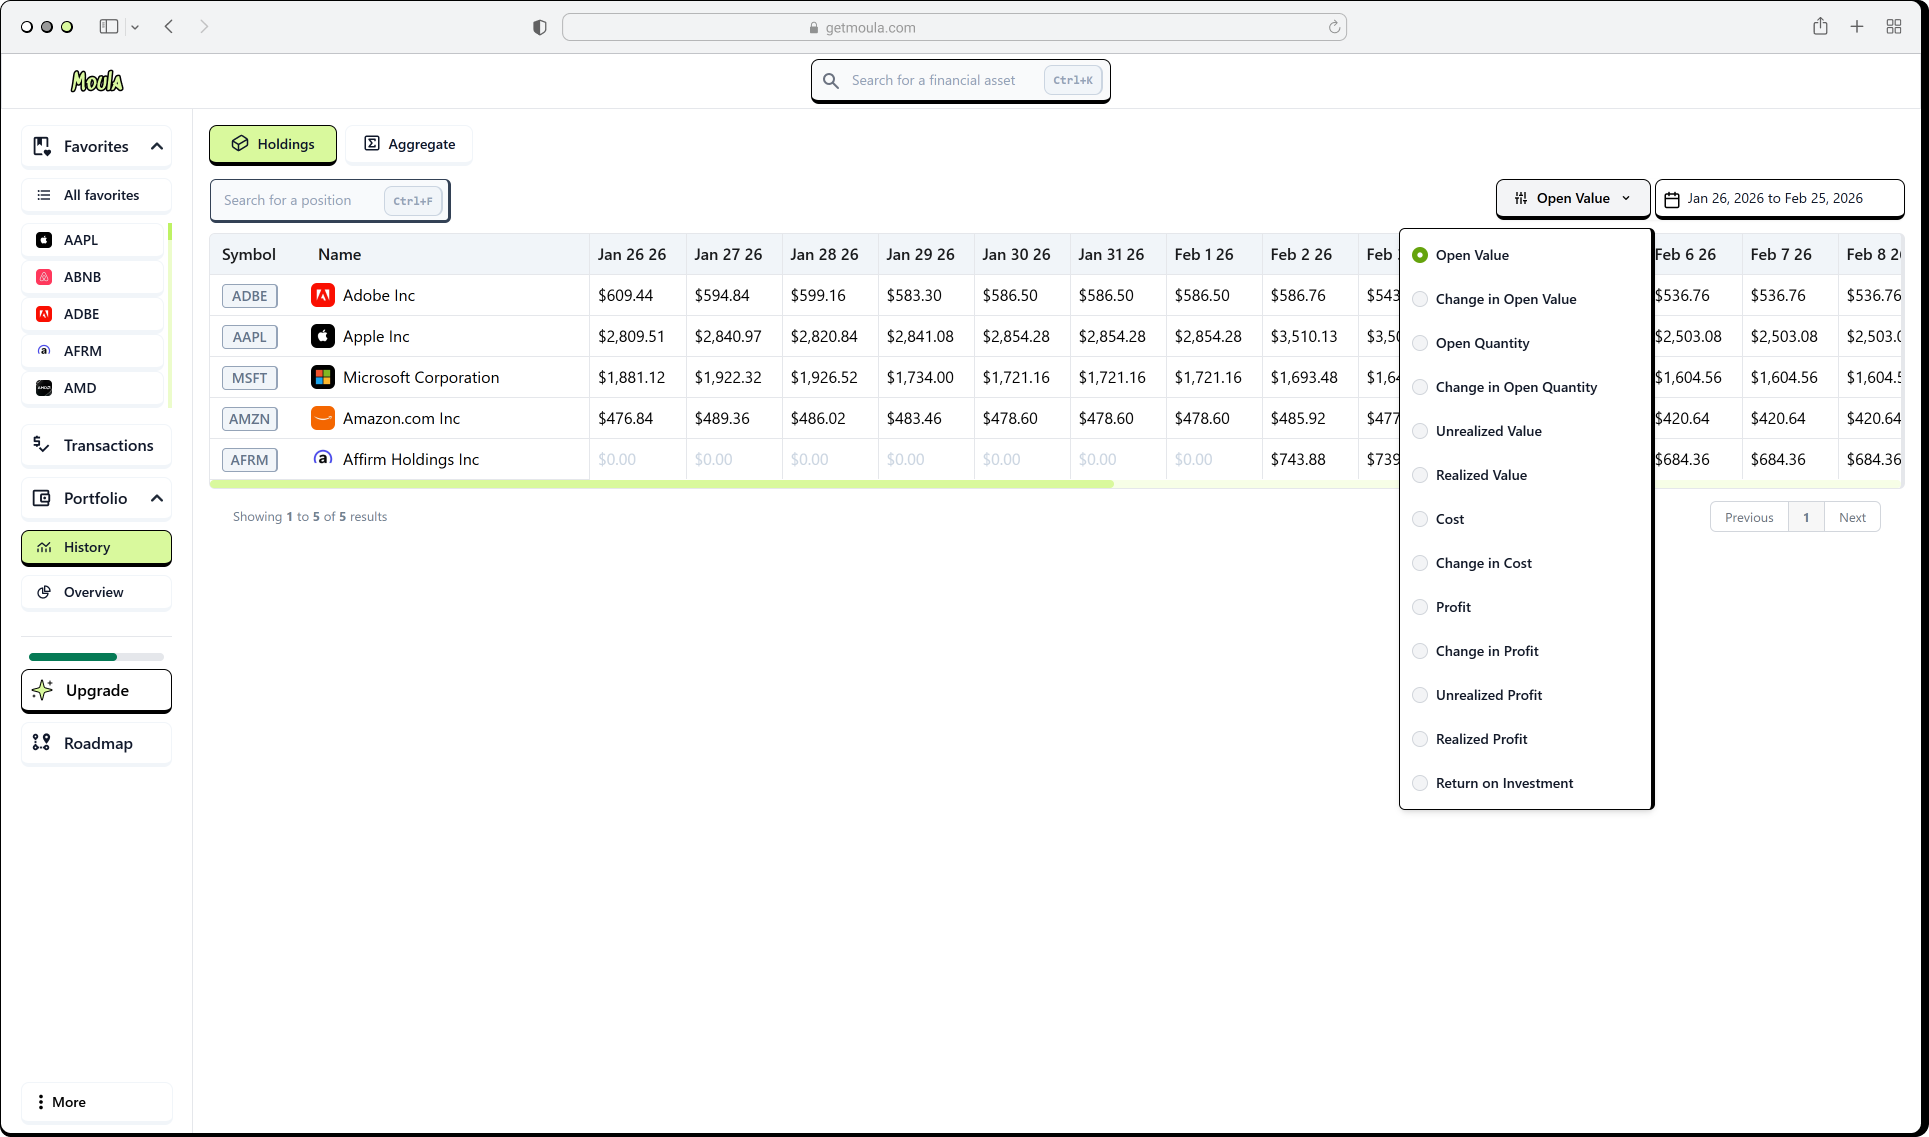
Track performance
Analyze stocks
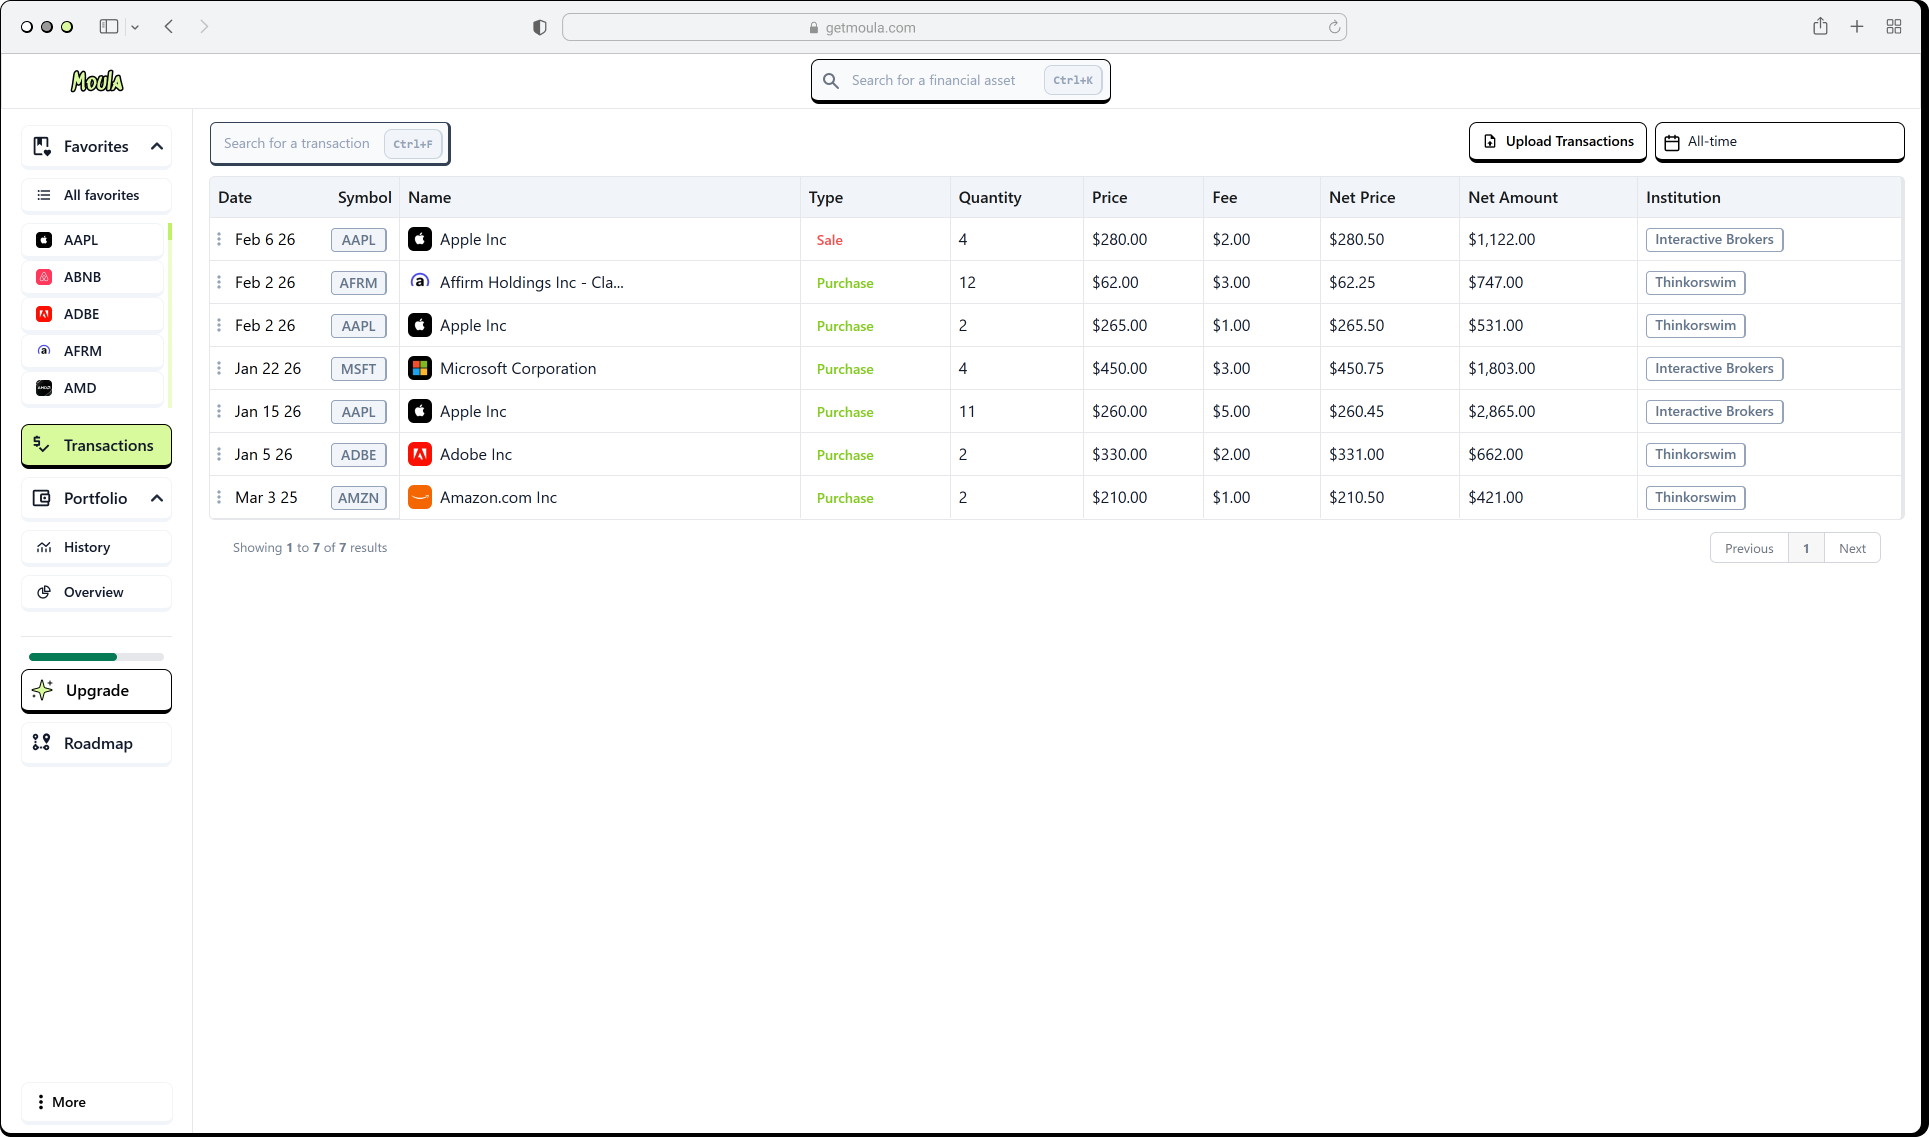
Centralize buys and sells from one or multiple brokers. Search, filter by date, upload CSV. Your journal stays clean and structured, no spreadsheet chaos.
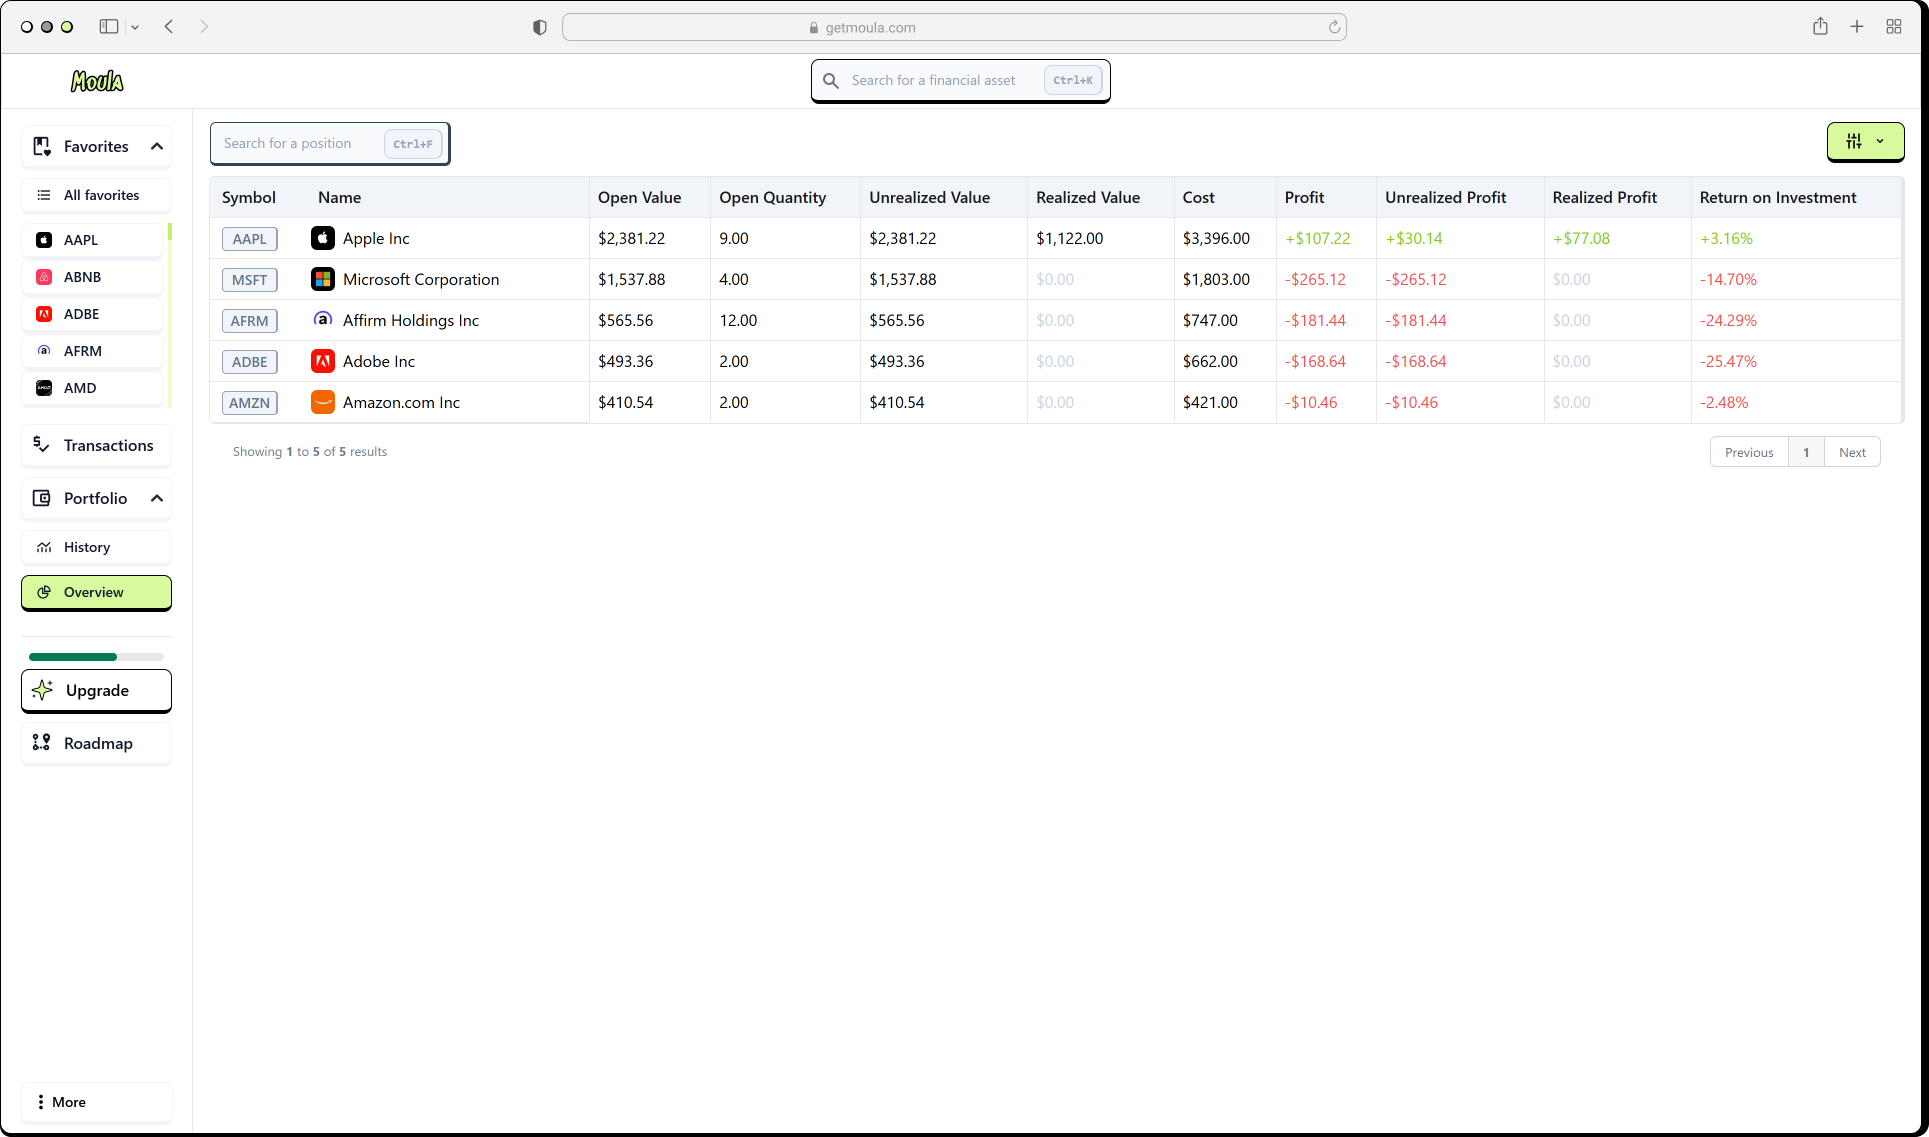
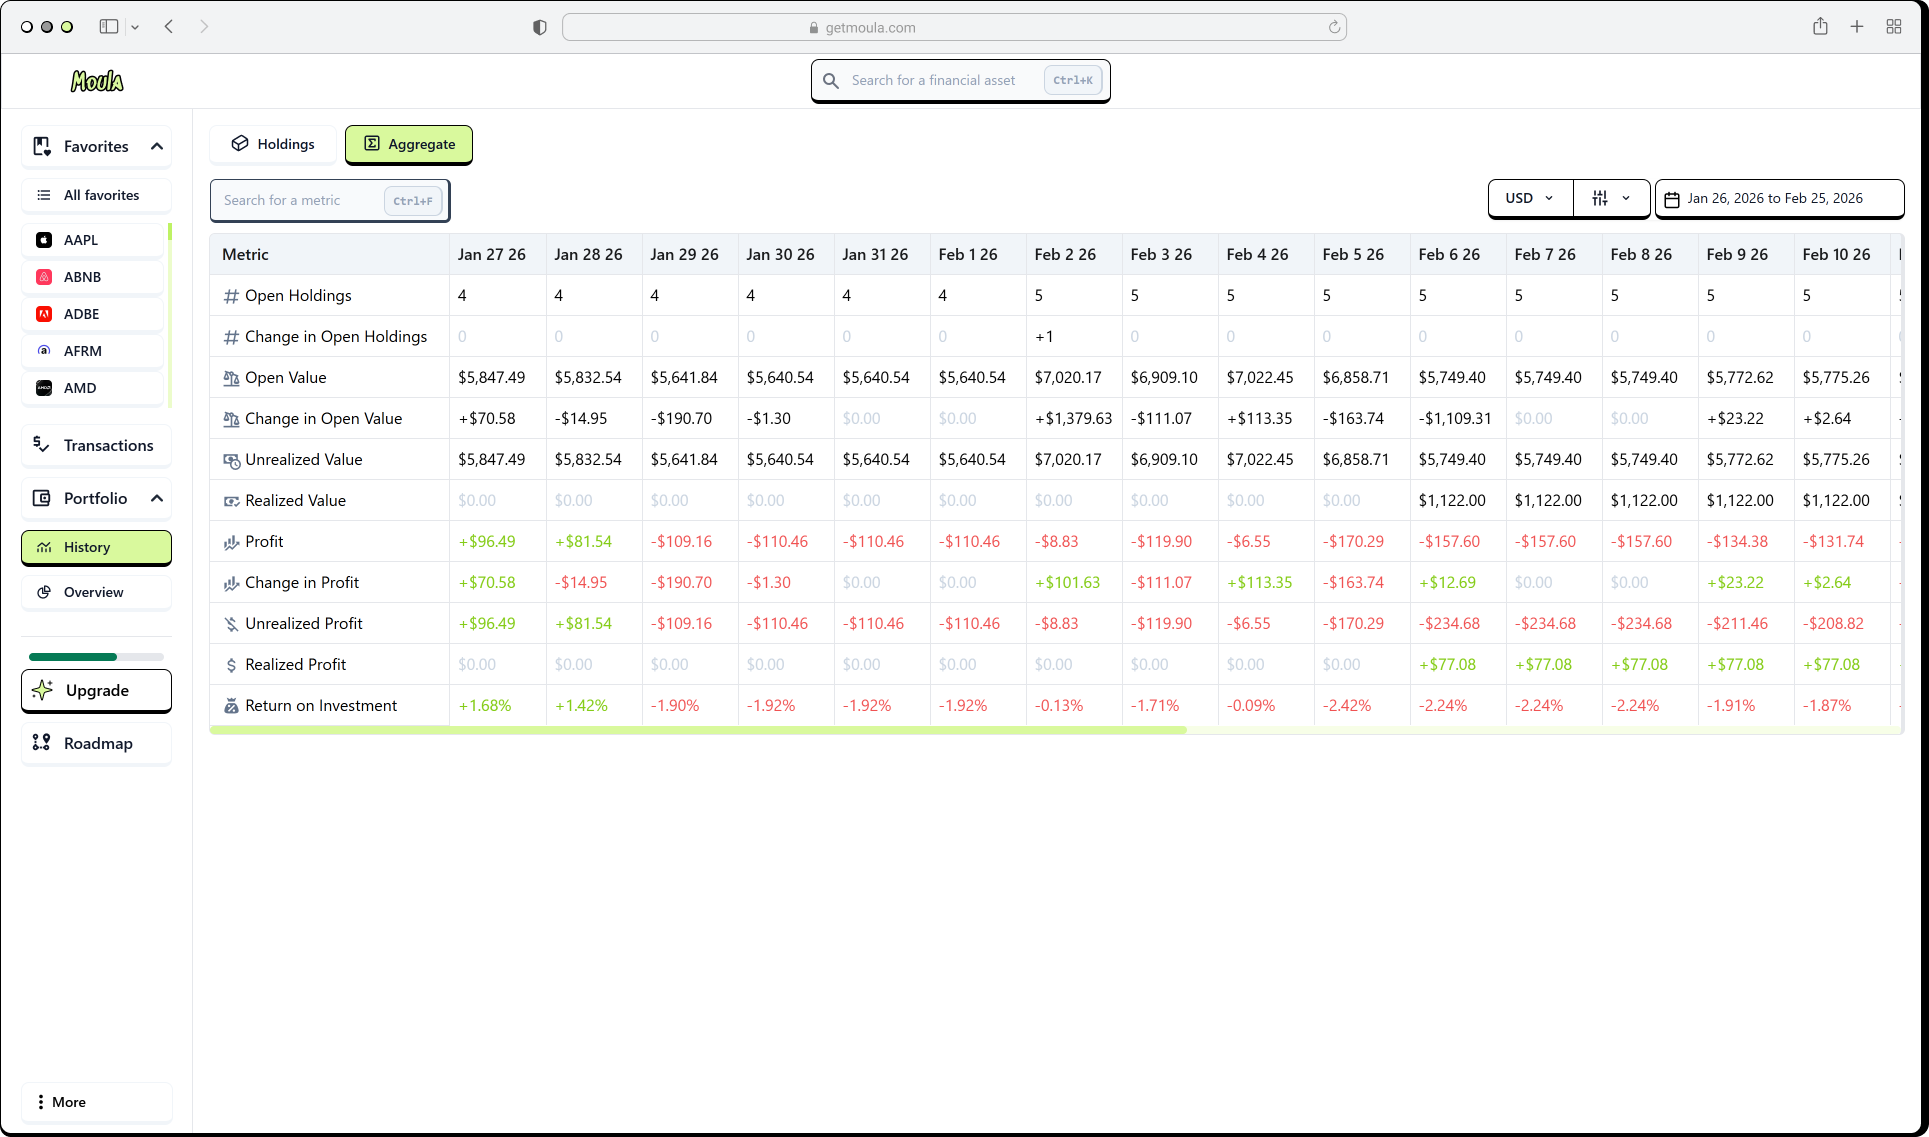
Portfolio performance derives automatically from your trades and updates daily. Open value, cost basis, unrealized and realized P&L, ROI, and more. Both per-holding and on aggregate.
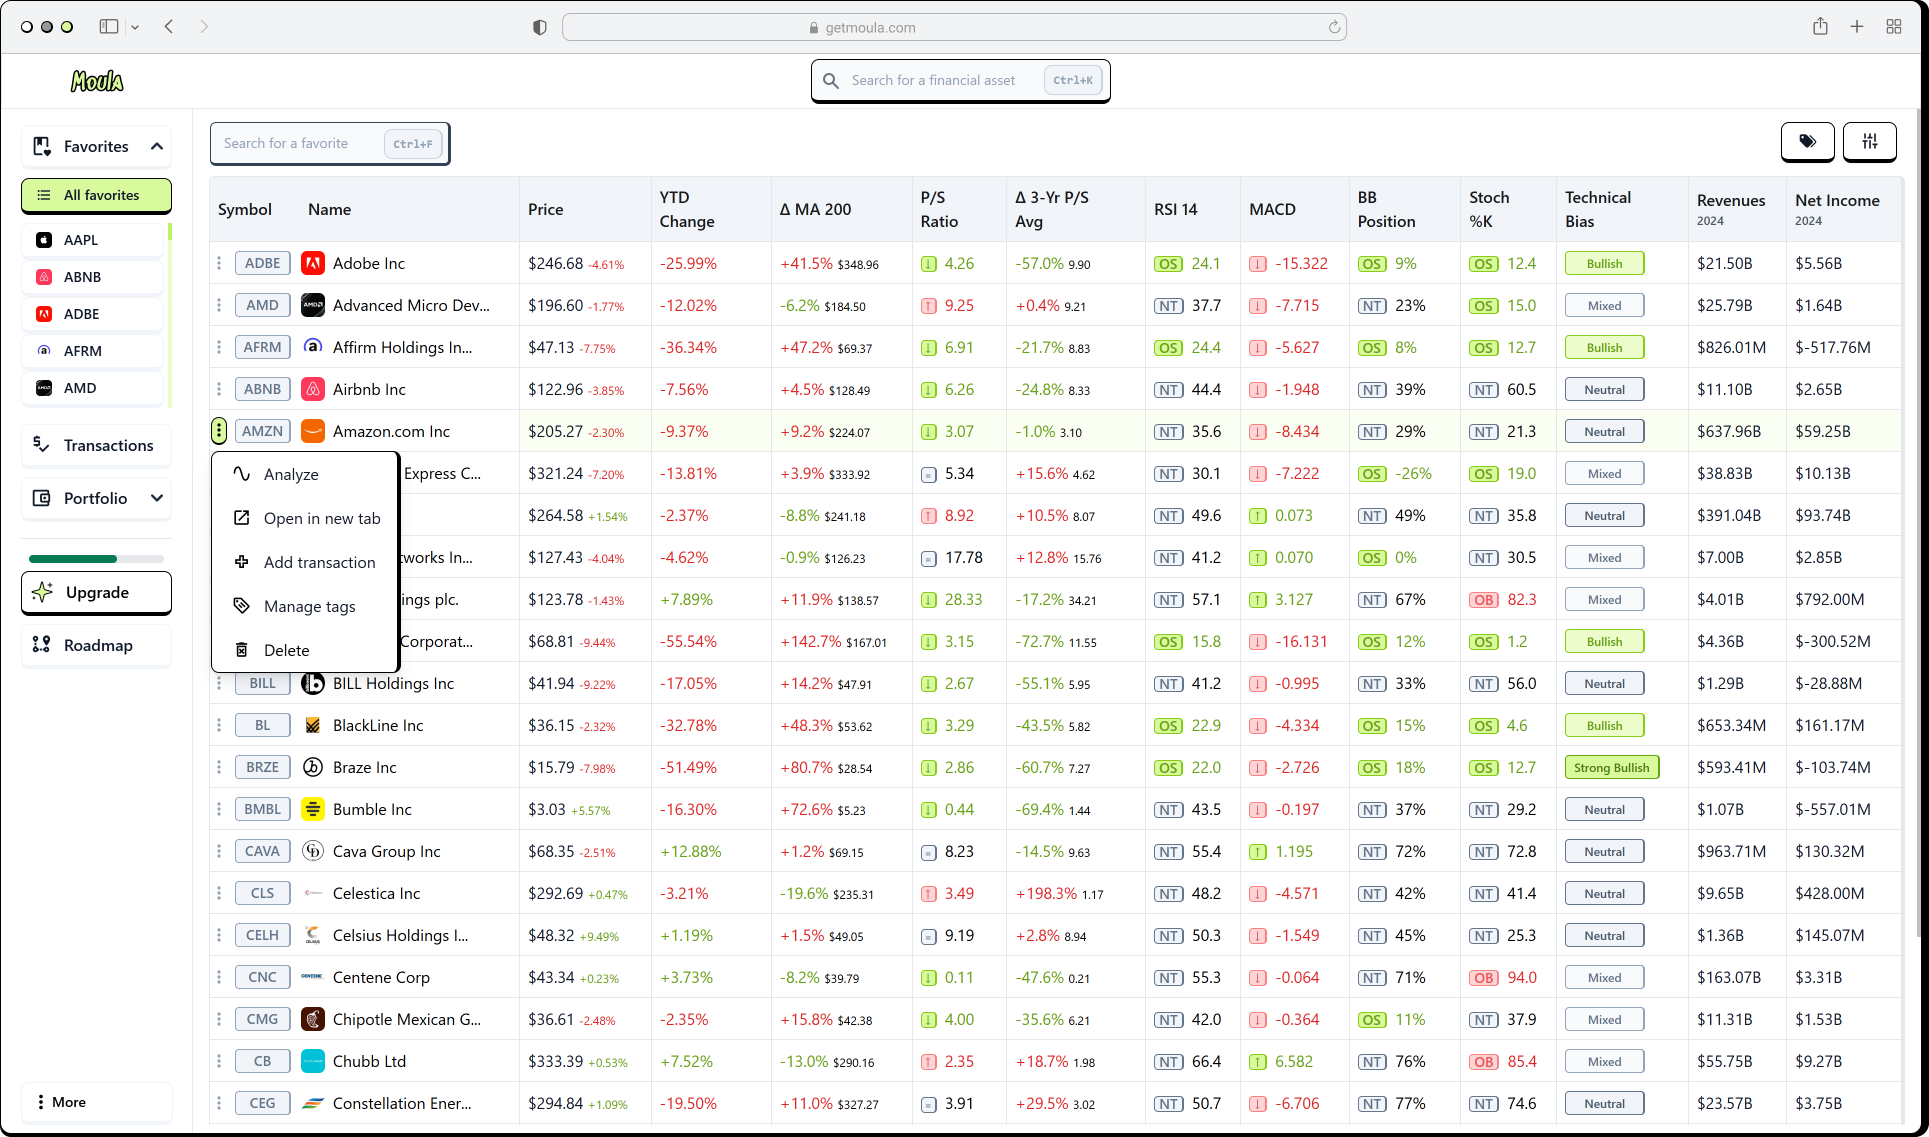
Charts, technical indicators, SEC financials, and valuation multiples. Set alerts on price or indicators and get notified by email. Your watchlist, research, and transactions in one place.
Your control layer, not another dashboard
Structure your trades, get insight from charts and fundamentals, and keep full control of your data.
Structure
Transaction journal
Log every buy and sell. Track cost basis and P&L over time.
Learn morePortfolio tracker
Total portfolio value and per-holding performance, updated daily. Gains and losses at a glance.
Learn moreTransaction journal
Log every buy and sell. Track cost basis and P&L over time.
Learn morePortfolio tracker
Total portfolio value and per-holding performance, updated daily. Gains and losses at a glance.
Learn moreTransaction journal
Log every buy and sell. Track cost basis and P&L over time.
Learn morePortfolio tracker
Total portfolio value and per-holding performance, updated daily. Gains and losses at a glance.
Learn moreTransaction journal
Log every buy and sell. Track cost basis and P&L over time.
Learn morePortfolio tracker
Total portfolio value and per-holding performance, updated daily. Gains and losses at a glance.
Learn moreInsight
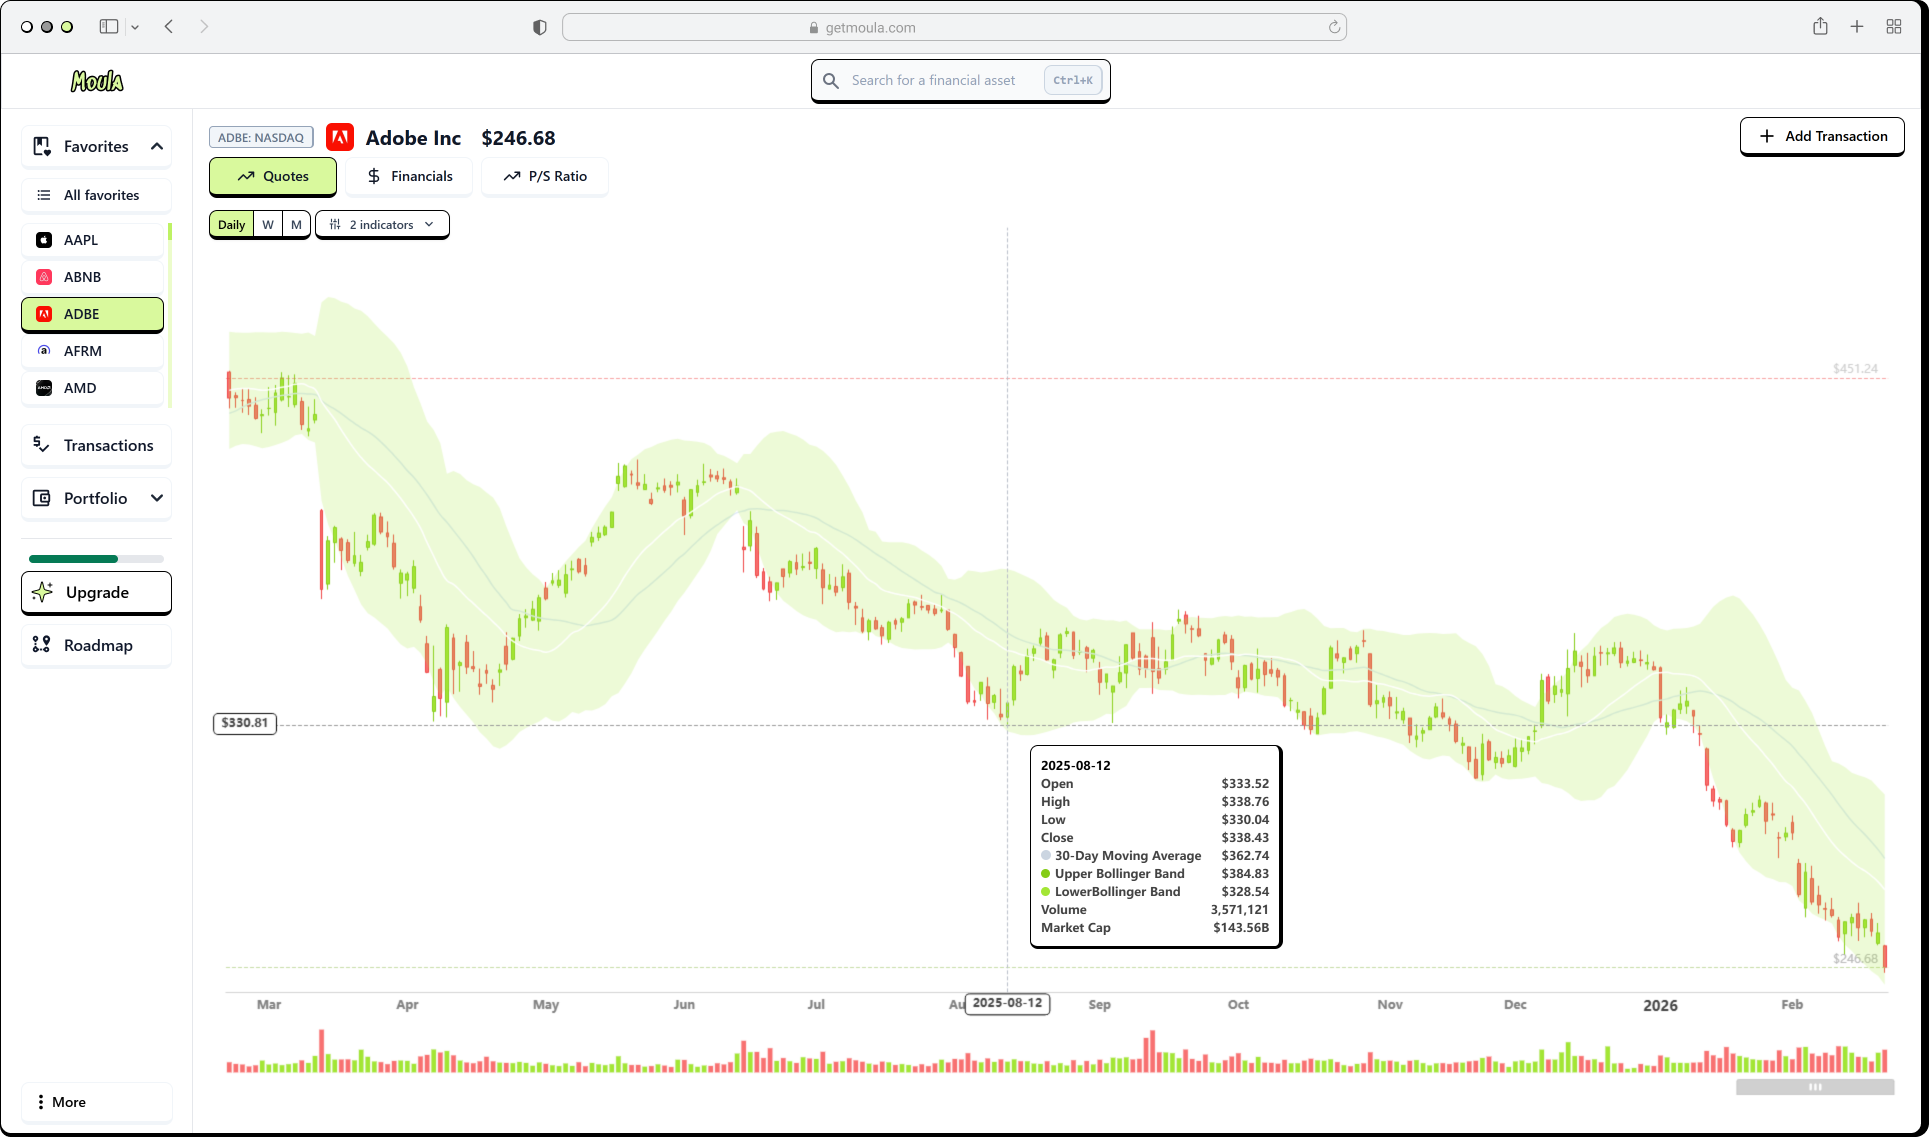
Candlestick charts
Ten years of end-of-day price history. Support and resistance levels highlighted.
Learn moreTechnical indicators
MACD, Bollinger Bands, RSI, Stochastic, and Moving Averages.
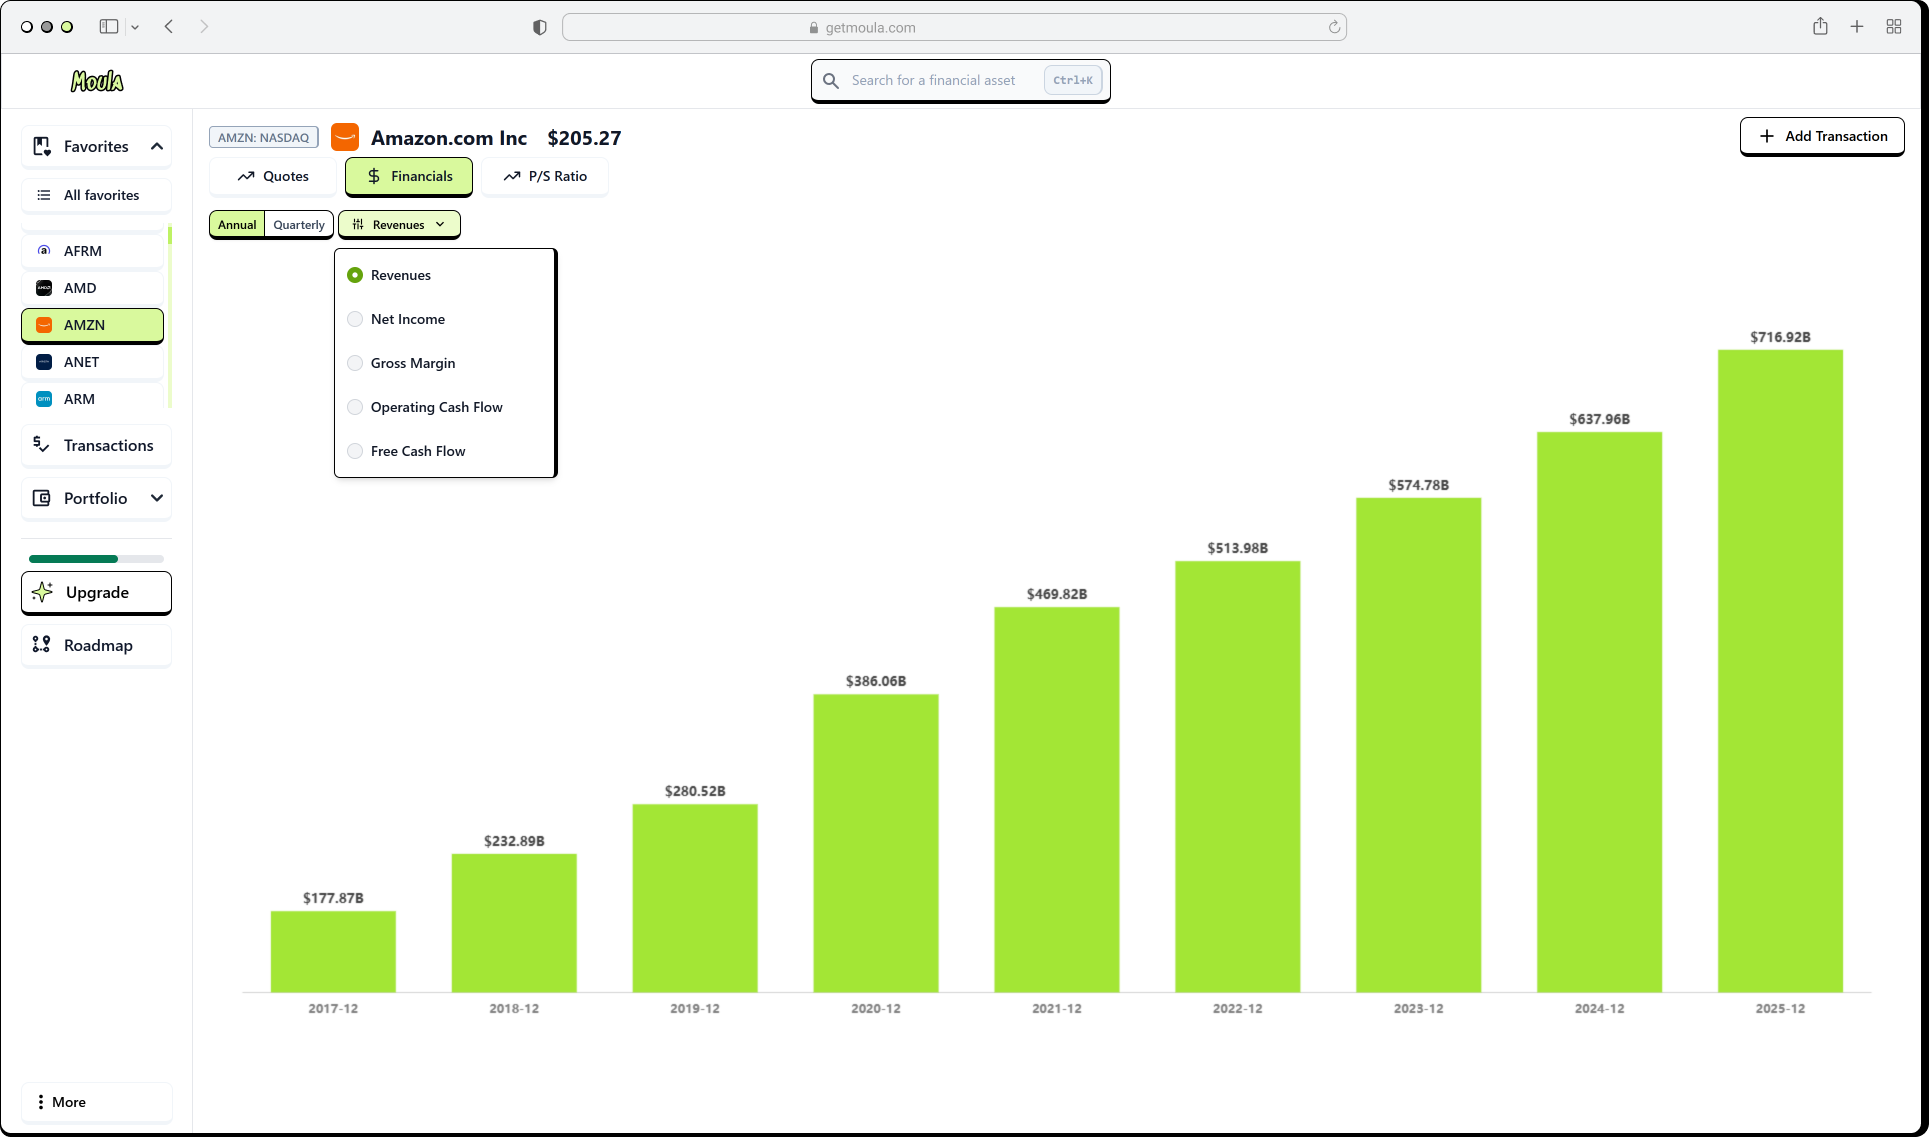
Learn moreSEC fundamentals
Revenue, net income, gross margin, cash flow. Sourced from SEC EDGAR filings.
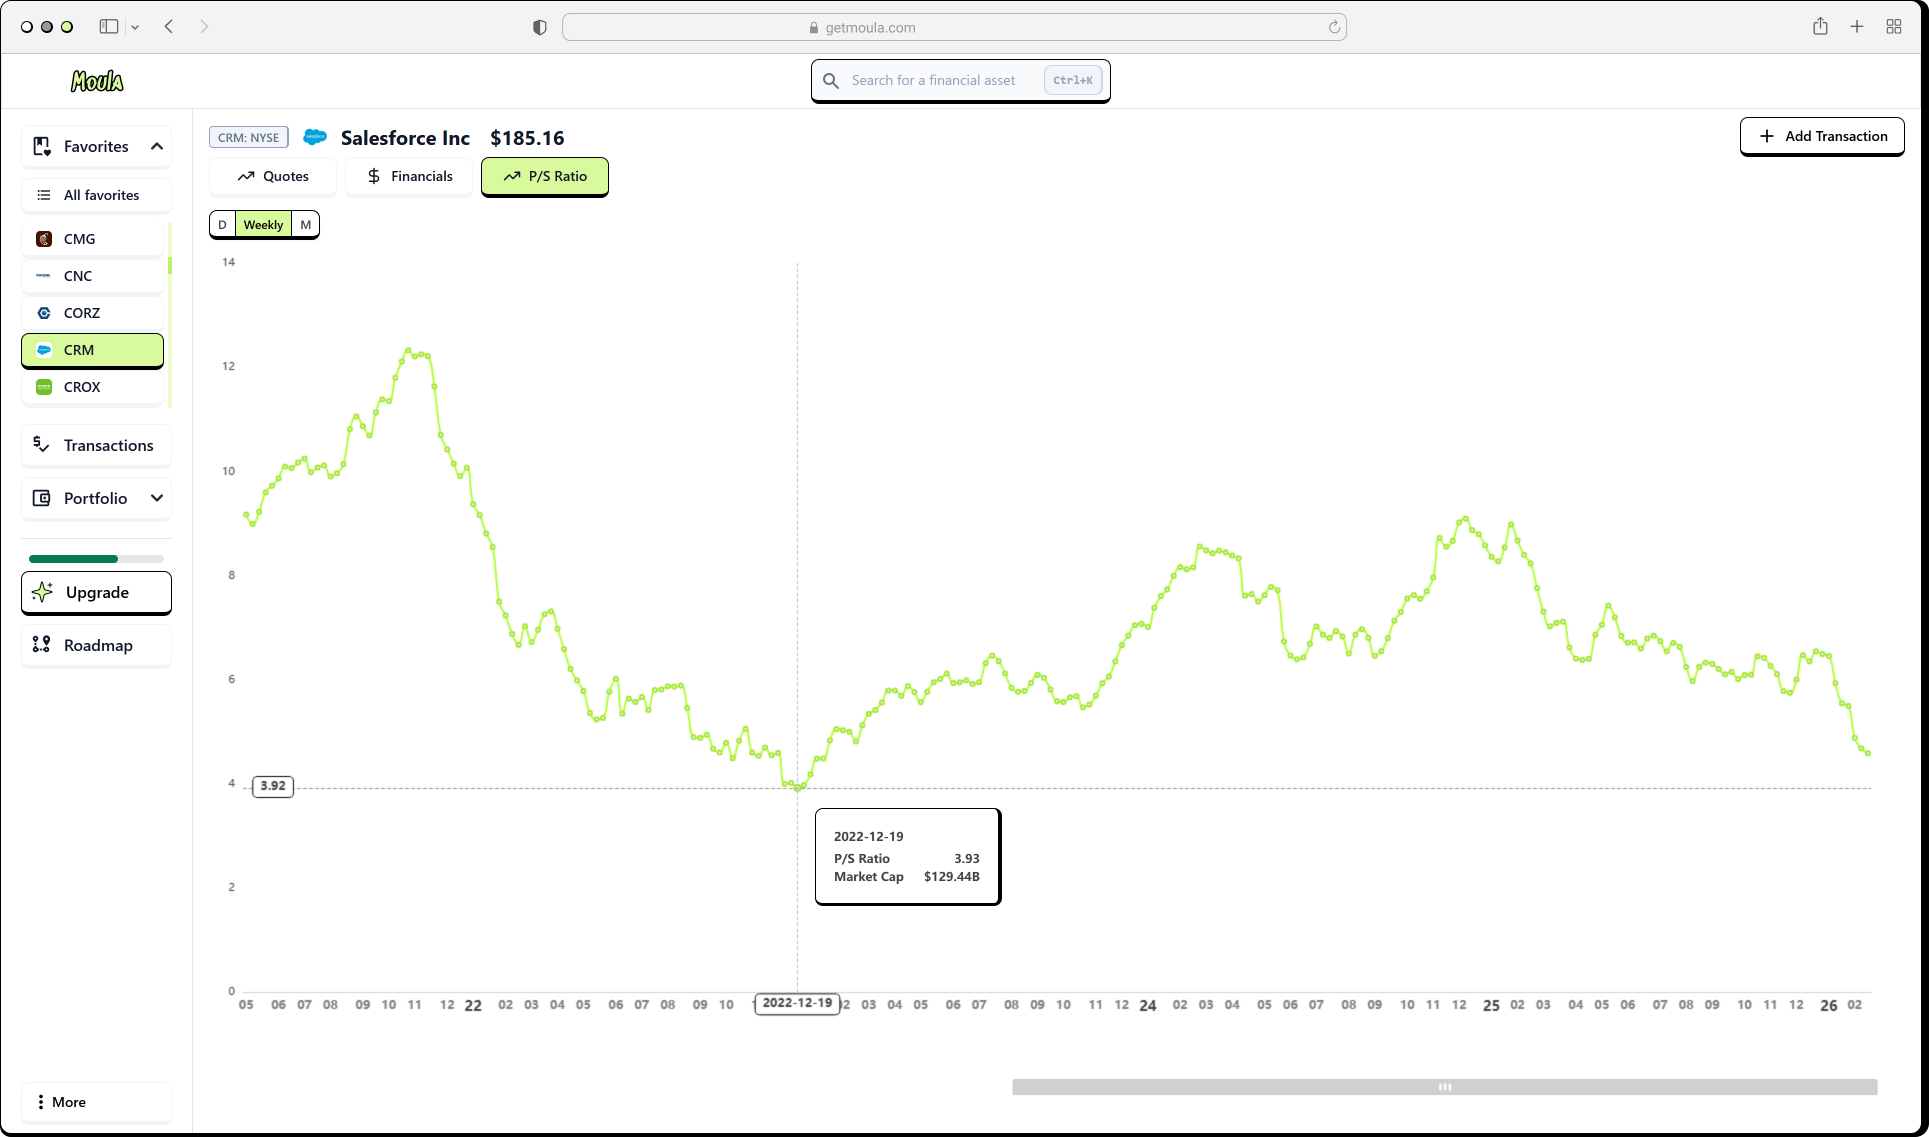
Learn moreValuation multiples
P/S ratio and market cap, historized. See when you're buying cheap or rich.
Learn morePrice & signal alerts
Get daily email alerts when price, P/S, P/E, RSI, or other conditions hit your thresholds.
Learn moreCandlestick charts
Ten years of end-of-day price history. Support and resistance levels highlighted.
Learn moreTechnical indicators
MACD, Bollinger Bands, RSI, Stochastic, and Moving Averages.
Learn moreSEC fundamentals
Revenue, net income, gross margin, cash flow. Sourced from SEC EDGAR filings.
Learn moreValuation multiples
P/S ratio and market cap, historized. See when you're buying cheap or rich.
Learn morePrice & signal alerts
Get daily email alerts when price, P/S, P/E, RSI, or other conditions hit your thresholds.
Learn moreControl
No broker connection
Private and secure by design. You log trades manually. Your data stays yours.
Learn moreManual logging
You log every trade. One source of truth.
Learn moreNo broker connection
Private and secure by design. You log trades manually. Your data stays yours.
Learn moreManual logging
You log every trade. One source of truth.
Learn moreNo broker connection
Private and secure by design. You log trades manually. Your data stays yours.
Learn moreManual logging
You log every trade. One source of truth.
Learn moreNo broker connection
Private and secure by design. You log trades manually. Your data stays yours.
Learn moreManual logging
You log every trade. One source of truth.
Learn moreFrequently asked questions
Ready to leave the spreadsheet behind?
Start free with 10 favorites. Log your trades, explore charts and financials, and watch your portfolio come to life. No broker connection, no credit card.